
Running your academy on numbers, not gut feeling
See growth, lectures, engagement, and revenue on one board — each compared to the previous period.
Quick facts
- Overview metrics
- Students, teachers, lectures, revenue, credits
- Comparison
- Every number vs the previous period
- Dashboards
- Overview, lectures, engagement, revenue
- Export
- CSV
When an academy grows past a certain point, decisions made on instinct start to cost money. Academies Hub turns the activity already happening on the platform into clear analytics you can act on — no separate spreadsheets, no manual tallying.
Start your day from one board
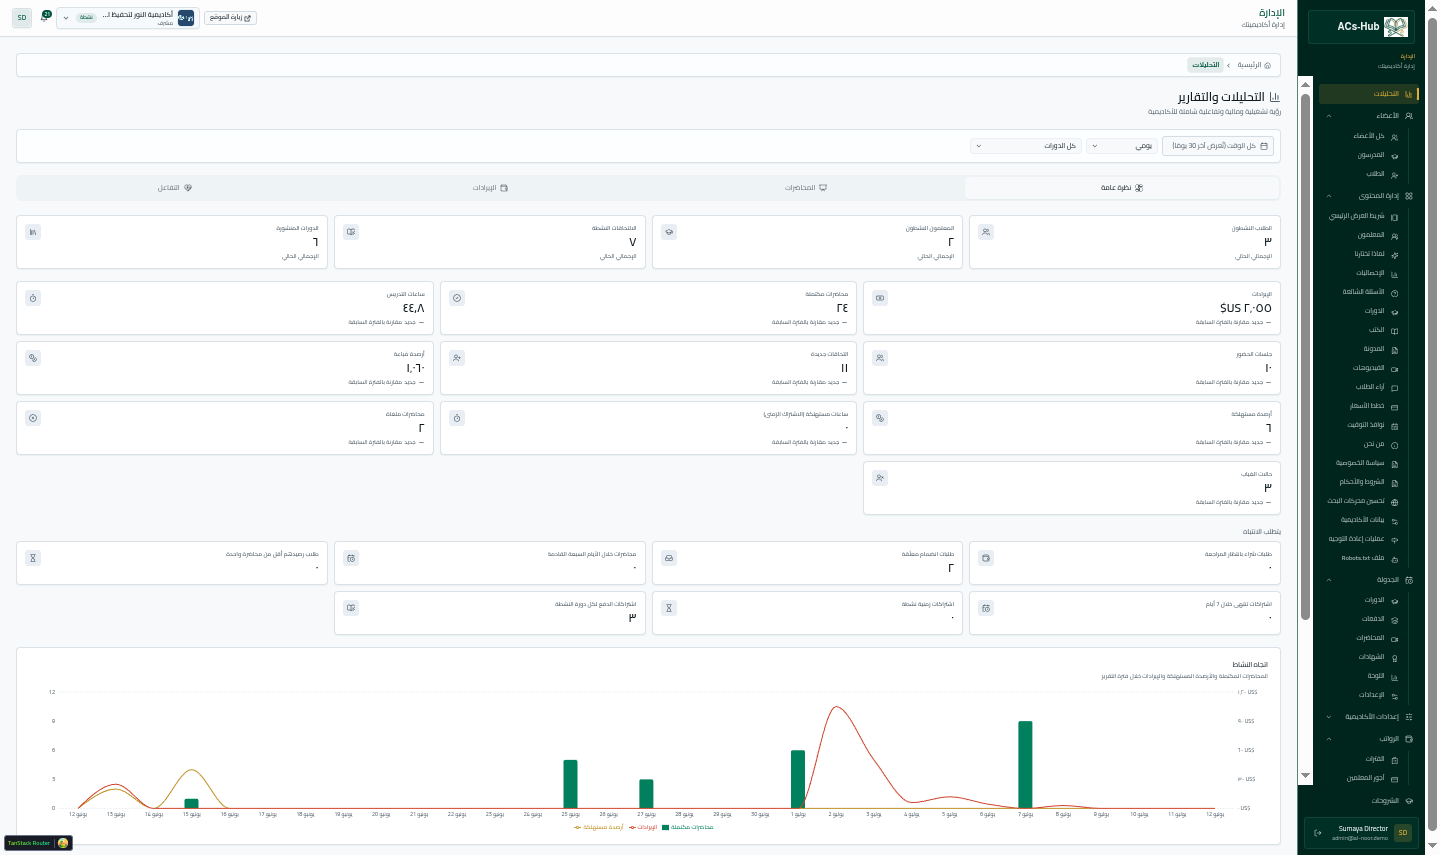
The overview shows active students and teachers, completed lectures, revenue, and credits sold versus consumed — each number compared to the previous period, with CSV export for when you need to dig deeper or share with a partner.
Drill into what's driving it
- Lecture analytics: completion rate, average session length, status mix, and peak hours
- Engagement analytics: enrollment status, new enrollments over time, assignments, ratings, and join requests
- Revenue analytics: income by payment method, best-selling packs, and attended sessions by method
Read the credit economy of your academy
Credits sold versus consumed is a quiet but powerful signal: a growing gap can mean students are buying and not attending, while consumption outpacing sales warns of balances about to run dry. Seeing both together helps you act before either becomes a problem.
Act before problems grow
Because every metric is compared to the previous period, you see momentum and warning signs early — a dip in completed lectures, a slowdown in enrollments, a shift in revenue mix — while there is still time to respond. Less guessing, more knowing.
Key takeaways
- One overview board covers students, teachers, lectures, revenue, and credits.
- Every figure is compared to the previous period to show momentum.
- Dedicated lecture, engagement, and revenue dashboards explain the why.
- Credits sold vs consumed reveals attendance and balance risks early.
Ready to run your academy on one platform?
See how Academies Hub brings scheduling, payments, memorization, exams, and analytics together.